
S&P 500
Dow Jones
Nasdaq
10-Year US Treasury Yield
British Pound per USD
Euro per USD
USD per Yen
Swiss franc per EUR
U.S. News
PCE Inflation, Personal Income, and Savings
- The Fed's preferred inflation gauge continued to moderate in June but remained well above the central bank's 2% target. Headline PCE inflation eased to 3.7% YoY from 4.1% in May, supported by lower energy prices, while core PCE inflation edged down to 3.3% from 3.4%, indicating persistent underlying price pressures.
- U.S. personal income increased 0.2% MoM in June, below the 0.3% consensus estimate. Meanwhile, the personal saving rate declined to 2.7%, down from 4.5% a year earlier.
Fed Interest Rate Decision and Treasury Yields
- The Federal Reserve held rates steady at 3.50%–3.75%, but the 9–3 vote revealed growing internal pressure to tighten policy, with three officials dissenting in favor of a 25 bps rate hike.
- The split reflects concerns that inflation remains above target amid persistent price pressures from energy, tariffs, and strong AI-related investment demand. Chair Kevin Warsh noted that rising market interest rates had already tightened financial conditions, providing some room to hold rates steady.
- Treasury yields rose sharply following the Fed's decision, with the 30-year U.S. Treasury yield reaching a 19-year high of 5.238% last Thursday. The move reflected uncertainty over the Fed's policy path, a lack of clear forward guidance under Chair Kevin Warsh's new communication approach, and concerns that policy may not remain sufficiently restrictive.
Q2 2026 GDP Advance Estimate
- U.S. GDP growth slowed to a 1.5% annualized rate in Q2 2026 from 2.1% in Q1, below the 1.8% consensus estimate.
- Import-driven drag from the AI investment boom weighed on GDP growth, as strong demand for imported semiconductors and AI infrastructure equipment led net exports to subtract ~1 percentage point from growth.
- Underlying economic momentum remained resilient, supported by consumer spending and AI-driven investment. Consumer spending accelerated to 3.2% growth from 0.5% in Q1, while investment in IT equipment, software, and data centers remained a key growth driver.
Jobless Claims
- Initial jobless claims, a measure of how many workers were laid off across the U.S., increased to 197,000 in the week ended July 24, up 9,000 from the prior week.
- The four-week moving average was 202,750, down 5,000 from the prior week.
- Continuing claims — those filed by workers unemployed for longer than a week — decreased at 1.782 million in the week ended July 17. This figure is reported with a one-week lag.

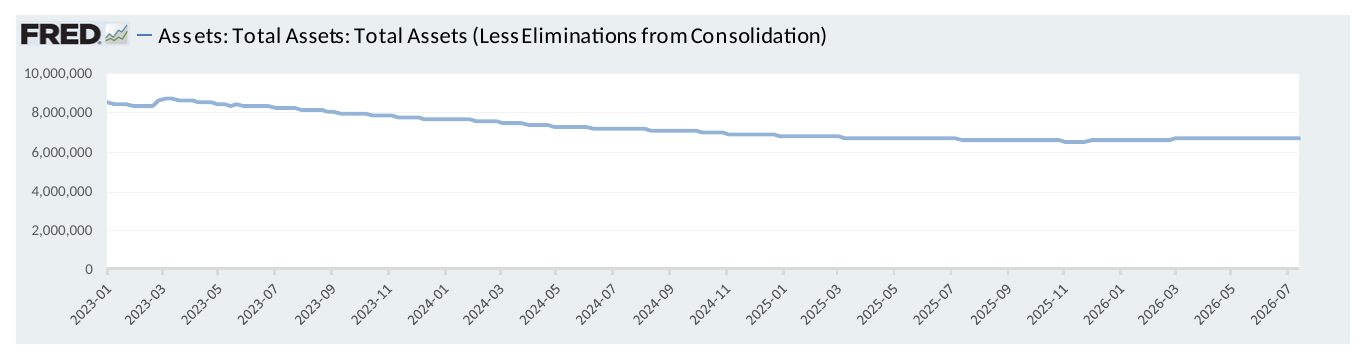
Fed's Balance Sheet
- The Federal Reserve's assets totaled $6.738 trillion in the week ended July 31, down $9.2 billion from the prior week.
- Treasury holdings totaled $4.519 trillion, up $7.7 billion from the prior week.
- Holdings of mortgage-backed securities (MBS) were $1.94 trillion in the week, down $9.6 billion from the prior week.
Total Public Debt
- Total public debt outstanding was $39.84 trillion as of July 31, an increase of 7.9% from the previous year.
- Debt held by the public was $32.04 trillion, and intragovernmental holdings were $7.78 trillion.

GDP
- The latest annualized U.S. GDP stands at $31.87 trillion as of March 31, 2026, an increase of 1.41% from the previous quarter, & an increase of 6.07% from the previous year.
- The total public debt-to-GDP ratio is at 122.59% as of March 31, an increase of 2.05% from the previous year.


Inflation Factors
CPI:
- The consumer-price index rose 3.5% in June year over year.
- On a monthly basis, the CPI decreased (0.4%) in June on a seasonally adjusted basis, after increasing 0.5% in May.
- The index for all items less food and energy (core CPI) fell 0.0% in June, after rising 0.2% in May.
- Core CPI increased 2.6% for the 12 months ending June.
Food & Beverages:
- The food at home index increased 2.7% in June from the same month a year earlier, and increased 0.2% in June month over month.
- The food away from home index increased 3.4% in June from the same month a year earlier, and increased 0.2% in June month over month.
Commodities:
- The energy commodities index decreased (9.5%) in June after increasing 6.7% in May.
- The energy commodities index rose 27.0% over the last 12 months.
- The energy services index rose 1.5% in June after increasing 0.7% in May.
- The energy services index rose 3.9% over the last 12 months.
- The gasoline index rose 26.7% over the last 12 months.
- The fuel oil index rose 42.9% over the last 12 months.
- The index for electricity rose 4.0% over the last 12 months.
- The index for natural gas rose 3.0% over the last 12 months.
Supply Chain:
- Drewry's composite World Container Index decreased to $4,254.73 per 40ft container for the week of July 31.
- Drewry's composite World Container Index has increased by 70.3% over the last 12 months.
Housing Market:
- The shelter index increased 0.1% in June after increasing 0.3% in May.
- The rent index increased 0.1% in June after increasing 0.3% in May.
- The index for lodging away from home decreased (2.5%) in June after increasing 2.6% in May.
Federal Funds Rate
- The effective Federal Funds Rate is at 3.63%, down (0.01%) year to date.

Money Market Funds
- Money market fund assets stood at $7.85 trillion as of July 29, 2026, down (0.1%) from the previous week, & up 11.0% from the previous year.

World News
Middle East
- President Trump canceled a planned military strike on Iran after announcing that the framework of a diplomatic agreement had been reached to reopen the Strait of Hormuz and address Iran's nuclear program. Trump said the U.S. and Israel would suspend further military action while negotiations proceed, marking a temporary de-escalation after renewed threats of conflict.
- Despite the diplomatic progress, geopolitical risks remain elevated. Iran has continued to effectively restrict traffic through the Strait of Hormuz, while recent attacks involving Kuwait, the Red Sea, and Gulf energy infrastructure underscore ongoing risks to global oil exports, shipping routes, and energy markets.
- Saudi Arabia's economy contracted 4.8% YoY in Q2 — the sharpest decline since the pandemic — as the U.S.-Iran conflict disrupted oil exports. Oil-sector GDP fell 24.7% following the effective closure of the Strait of Hormuz, while Houthi attacks have also threatened the kingdom's alternative Red Sea export route via the Bab al-Mandab Strait, one of the last remaining routes carrying Gulf crude to global markets.
- Despite the conflict, the Saudi government continued investing in strategic priorities, with infrastructure and transport spending increasing 21% YoY and military spending up 12%. The IMF expects GDP growth to slow to 1.7% in 2026 before recovering to 5.5% in 2027 as shipping through the Strait of Hormuz normalizes, supported by resilient domestic demand, government spending, and continued execution of capital projects.
Europe
- Eurozone GDP grew 0.4% QoQ in Q2 2026 (1.8% annualized), outpacing U.S. growth of 1.5% annualized despite Middle East conflict-related energy and supply chain disruptions. Growth was supported by resilient domestic demand, easing inflation, and strength in services activity.
- AI-driven digital services supported near-term Eurozone growth, with Ireland's GDP rebounding 3.9% QoQ in Q2, driven by the information and communications sector. However, ongoing geopolitical tensions, higher energy costs, and potential U.S. tariffs remain downside risks to the broader recovery.
- The EU is accelerating investment in AI infrastructure through a €10 billion public funding initiative to develop up to seven AI gigafactories, targeting an additional €20 billion in private investment. The program aims to expand Europe's AI compute capacity and strengthen its competitiveness versus the U.S. and China.
China
- China's manufacturing activity unexpectedly contracted in July, with the official PMI falling to 49.2 from 50.3, marking the first contraction in five months. The slowdown reflects continued weakness in domestic demand, a prolonged property downturn, and seasonal production factors.
- China's policymakers signaled limited appetite for broad-based stimulus despite slowing growth, favoring targeted fiscal support and structural reforms instead. The Politburo pledged to accelerate fiscal spending and the use of bond proceeds, expand domestic demand, and stabilize the property sector, but made no changes to the fiscal budget or bond issuance plans.
- China continues to prioritize technology and advanced manufacturing as long-term growth engines rather than consumer-led stimulus. Policymakers remain focused on emerging industries, capital-market reforms, and addressing corporate overcapacity.
- High-tech manufacturing remained a relative bright spot despite the broader slowdown, with equipment and high-tech manufacturing PMIs at 51.4 and 53.3, respectively. The resilience highlights continued strength in strategic industrial segments even as traditional manufacturing and construction remain under pressure.
Venezuela
- U.S.-backed talks between Venezuela's interim government and parts of the opposition began on August 1, aiming to establish a path toward democratic elections, but exclude prominent opposition leader María Corina Machado and lack a clear election timetable. The talks reflect the Trump administration's efforts to advance a political transition while supporting Venezuela's economic stabilization and reopening the country to U.S. investment.
India
- Indian companies are ramping up overseas acquisitions to diversify markets, access technology, and strengthen supply chains amid geopolitical uncertainty, with outbound investments reaching $14 billion in the first four months of fiscal 2026, compared with $18.7 billion in the prior full year. Major deals include Sun Pharma's $11.7 billion acquisition of US-based Organon and Persistent Systems' €1.3 billion bid for Germany-based Nagarro.
Colombia
- Far-right populist Abelardo de la Espriella — a criminal defense attorney who has represented paramilitary commanders and money launderers — captured 44% of the vote in Colombia's first-round presidential election, setting up a June 21 runoff against leftist Iván Cepeda that presents voters with the starkest ideological choice in the country's modern political history
Africa
- The WHO declared a global health emergency over an Ebola outbreak in Congo and Uganda, with around 80 deaths and over 200 suspected cases recorded — including cases in both countries' capitals — involving the rare Bundibugyo strain for which no approved vaccine or treatment currently exists
Cuba
- CIA Director Ratcliffe made a rare visit to Havana to warn Cuban officials they have a limited window to engage with the Trump administration, as the island faces severe fuel shortages, widespread blackouts, and growing street protests
Australia
- Australia is permanently diversifying its oil imports beyond Middle East suppliers and accelerating its renewable energy transition, even as it secures emergency fuel reserves to buffer against the ongoing Strait of Hormuz disruption
Canada
- Canada approved Enbridge's ~$3 billion Westcoast pipeline expansion, adding 300 million cubic feet per day of capacity as part of PM Carney's push to reduce U.S. trade dependence and boost Asian energy exports
Italy
- Trump publicly broke with Italian PM Giorgia Meloni — once his closest European ally — after she refused to send forces to the Strait of Hormuz and called his attacks on Pope Leo "unacceptable," leaving her isolated on both sides of the Atlantic
Japan
- Japan will release an additional 20 days' worth of oil reserves in early May to stabilize energy prices, as the country relies on the Middle East for over 90% of its crude imports and the Strait of Hormuz remains largely blocked
Commodities News
Oil Prices
- WTI: $84.67 per barrel
- (5.20%) WoW; +13.01% YTD; +20.96% YoY
- Brent: $90.12 per barrel
- (6.88%) WoW; +14.73% YTD; +24.25% YoY

US Production
- U.S. oil production amounted to 13.8 million bpd for the week ended July 24, down 0.1 million bpd from the prior week.
Rig Count
- The total number of oil rigs amounted to 588, up 1 from last week.
Inventories
Crude Oil
- Total U.S. crude oil inventories now amount to 404.5 million barrels, down (5.2%) YoY.
- Refiners operated at a capacity utilization rate of 97.2% for the week, up from 96.1% in the prior week.
- U.S. crude oil imports now amount to 5.806 million barrels per day, down (7.4%) YoY.
Gasoline
- Retail average regular gasoline prices amounted to $4.11 per gallon in the week of July 31, up 30.3% YoY.
- Gasoline prices on the East Coast amounted to $4.12, up 32.2% YoY.
- Gasoline prices in the Midwest amounted to $3.97, up 28.2% YoY.
- Gasoline prices on the Gulf Coast amounted to $3.79, up 33.1% YoY.
- Gasoline prices in the Rocky Mountain region amounted to $4.22, up 29.9% YoY.
- Gasoline prices on the West Coast amounted to $5.25, up 27.1% YoY.
- Motor gasoline inventories were up by 0.0 million barrels from the prior week.
- Motor gasoline inventories amounted to 211.3 million barrels, down (7.5%) YoY.
- Production of motor gasoline averaged 9.88 million bpd, down (1.6%) YoY.
- Demand for motor gasoline amounted to 9.041 million bpd, down (1.2%) YoY.

Distillates
- Distillate inventories decreased by 1.1 million in the week of July 31.
- Total distillate inventories amounted to 110.6 million barrels, down (2.6%) YoY.
- Distillate production averaged 5.364 million bpd, up 3.0% YoY.
- Demand for distillates averaged 3.524 million bpd in the week, down (2.2%) YoY.
Natural Gas
- Natural gas inventories increased by 28 billion cubic feet last week.
- Total natural gas inventories now amount to 3,084 billion cubic feet, down (1.2%) YoY.

Credit News
High-yield:
High yield bond yields decreased 2bps to 7.44% and spreads widened 2bps to 311bps. Leveraged loan yields increased 2bps to 9.09% and spreads widened 2bps to 493bps. WTD high yield bond returns were positive 17bps while WTD leveraged loan returns were positive 8bps. 10yr treasury yields increased 6bps to 4.73%. High yield spreads widened modestly as investors digested the latest Fed decision, continued earnings releases and greater credit dispersion across issuers. Despite modest spread widening, leveraged loans remained relatively resilient, supported by strong CLO demand, positive fund flows and active primary market issuance.
Week ended 07/31/2026
Yields & Spreads¹

Pricing & Returns¹

Fund Flows²

New Issue²
Distressed Level (trading in excess of 1,000 bps)²

Total HY Defaults

Leveraged loans:
Week ended 07/31/2026
Yields & Spreads¹

Pricing & Returns¹

Fund Flows²
New Issue²

Distressed Level (loan price below $80)¹
Total Leveraged Loan Defaults

Default activity:
- Most recent defaults include: Dish DBS ($9.8bn, 6/30/2026), QVC Group ($2.2bn, 4/16/2026), Cumulus Media ($641mn, 03/05/2026), Trinseo ($390mn, 02/17/2026), Beasley Broadcasting Group ($189mn, 02/01/2026), Nine Energy Service ($300mn, 02/01/2026), Multi-Color ($4.5bn, 01/29/2026), Pretium Packaging ($201mn, 01/28/2026), Saks Global Enterprises ($2.7bn, 12/30/2025), and United Site Services ($2.6bn, 11/30/2025).
CLOs:
Week ended 07/31/2026
New U.S. CLO Issuance²

New U.S. CLO YTD Issuance²

Note: High-yield and leveraged loan yields and spreads are swap-adjusted
¹ Source: Credit Suisse High Yield and Leveraged Loan Index
² Source: JP Morgan
Ratings activity:
S&P and Moody's High Yield Ratings
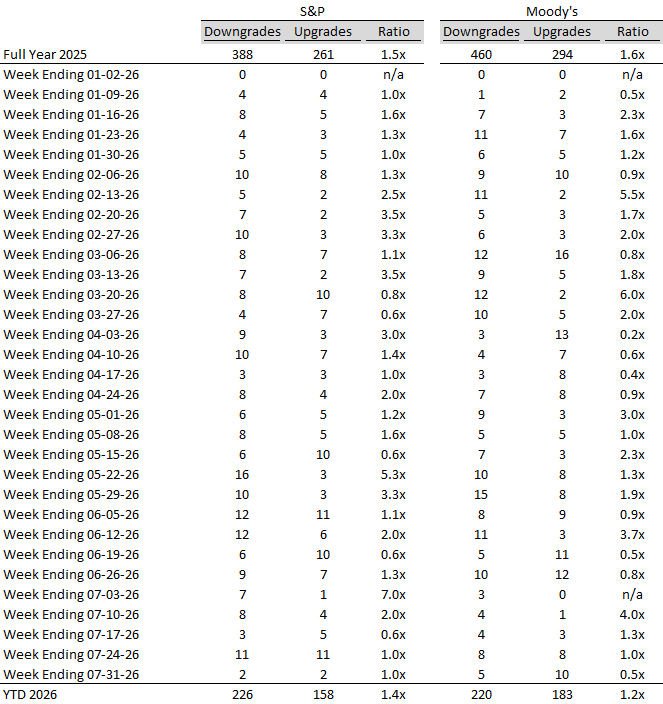
Source: Bloomberg
Appendix:
Diagram A: Leveraged Loan Trading Levels

Source: Credit Suisse Leveraged Loan Index
Diagram B: High Yield and Leveraged Loan LTM Price
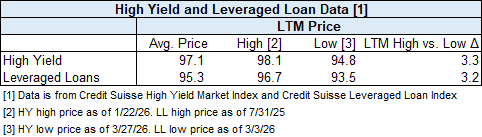
Diagram C: Leveraged Loan and High Yield Returns

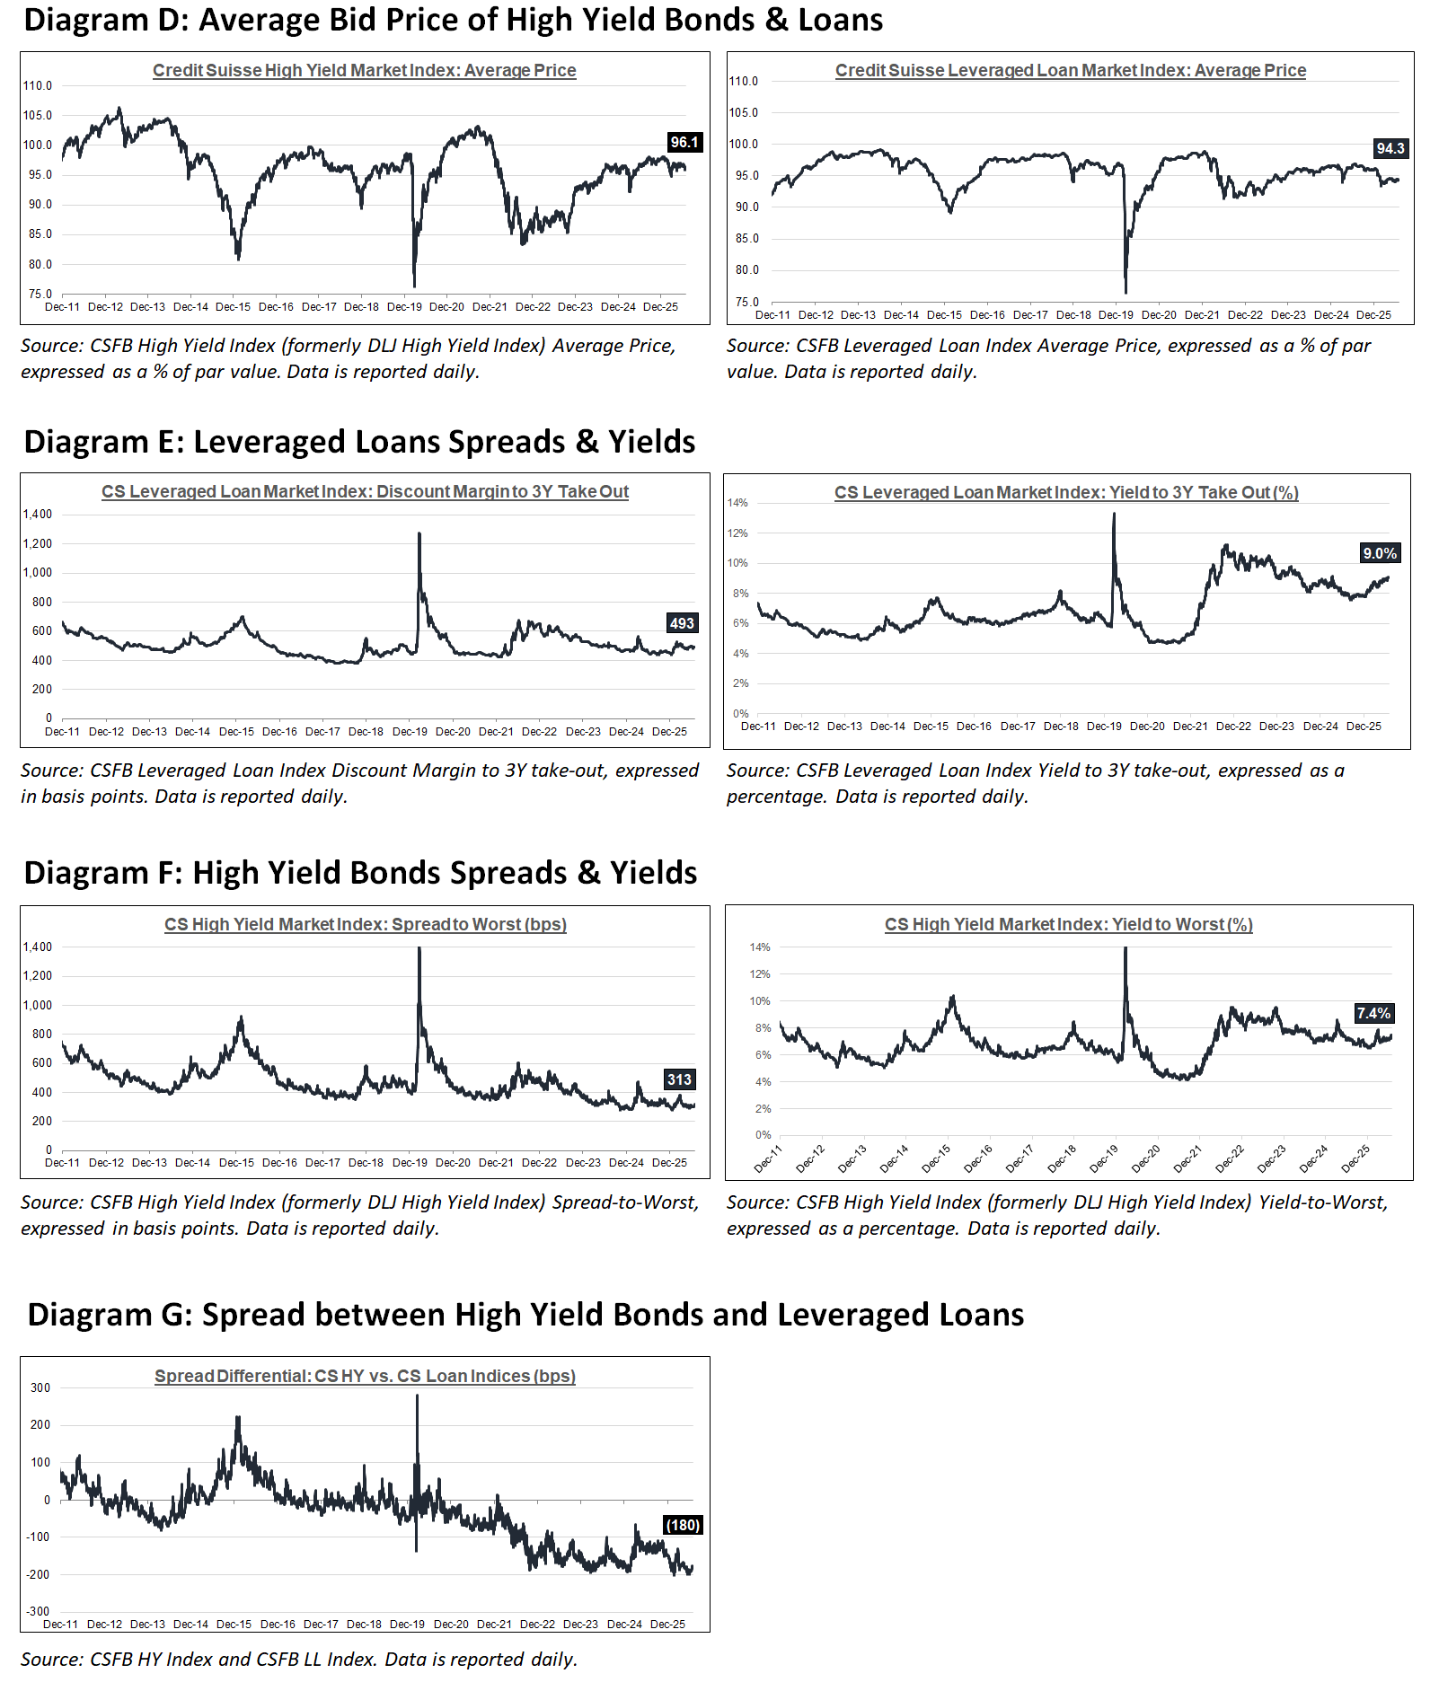

Diagram J: New Issue - Leveraged Loan and High Yield

Diagram K: Leveraged Loan + HY Defaults by Sector – LTM

Source: JP Morgan Default Monitor
Diagram L: CLO Economics
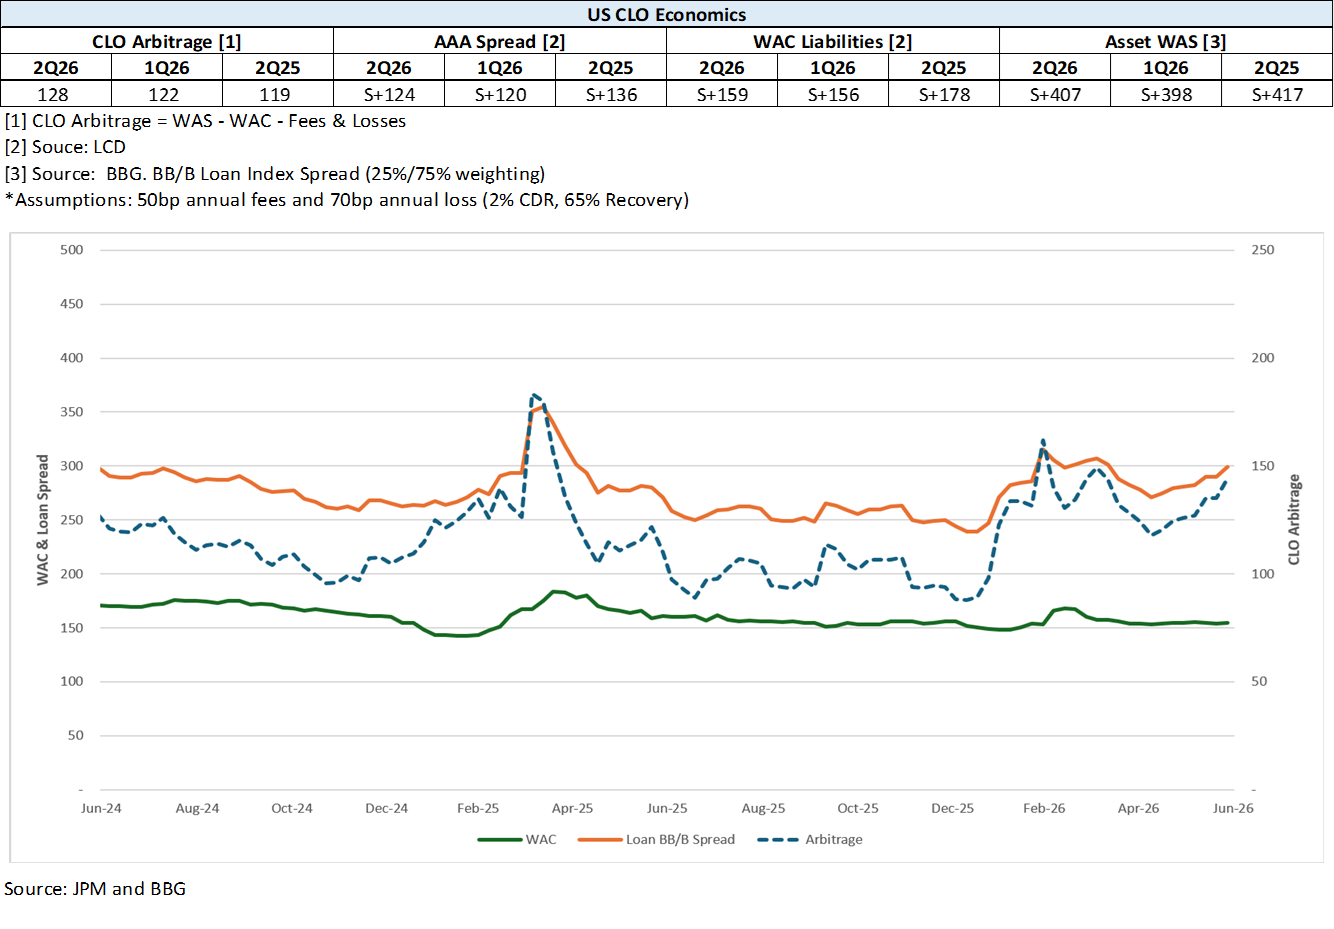
Diagram M: Developed Country Govt. Bond Yields (%)
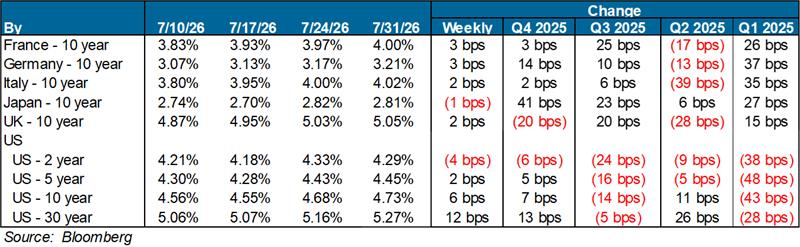
Diagram N: S&P 500 Historical Multiples

Source: S&P Capital IQ
Diagram O: U.S. Middle-Market M&A Valuations (EV/EBITDA)

Source: Pitchbook
Diagram P: U.S. Large Cap M&A Valuations (EV/EBITDA)

Source: Pitchbook
Diagram Q: Dry Powder for All Private Equity Buyouts ($B)


Diagram R: Dry Powder for All US Debt ($B)


Diagram S: Structured Credit Spreads

Source: Bloomberg
Diagram T: Structured Credit Yield

Source: Bloomberg
Diagram U: SOFR Curve

Diagram V: CMBS Spreads

Source: Bloomberg